
Transform delivery with a data-driven framework for measurable project success.

How Minfy Uses Data-Driven Delivery to Engineer Project Success

|

By

Rama Krishna Vaddi

August 29, 2025

How Minfy Uses Data-Driven Delivery to Engineer Project Success

In a world where speed was once the only priority, modern delivery requires more. It’s not enough to deliver quickly; the process must be measurable, predictable, and repeatable. At Minfy, we have embraced this change by creating a Data-Driven Delivery Framework that combines agile execution with a strong focus on measurable success metrics. This blog outlines the framework’s components, not as a theory, but as an effective system that helps us monitor progress, improve collaboration, and achieve real business results. Whether you’re a delivery manager, engineering lead, or developer, this is a practical look at how data can lead to smarter and more profitable software delivery.

Why Data-Driven Delivery Matters

Traditional success metrics for projects, such as completing sprints or meeting deadlines, don’t provide the full picture. How efficient were our resources? Were the estimates realistic? Did we keep customers engaged throughout? Were we profitable? A data-driven approach clarifies these questions. It connects every task, bug, or change request to a measurable impact on effort, cost, customer satisfaction, and long-term value.

Framing Delivery Through Measurable Discovery

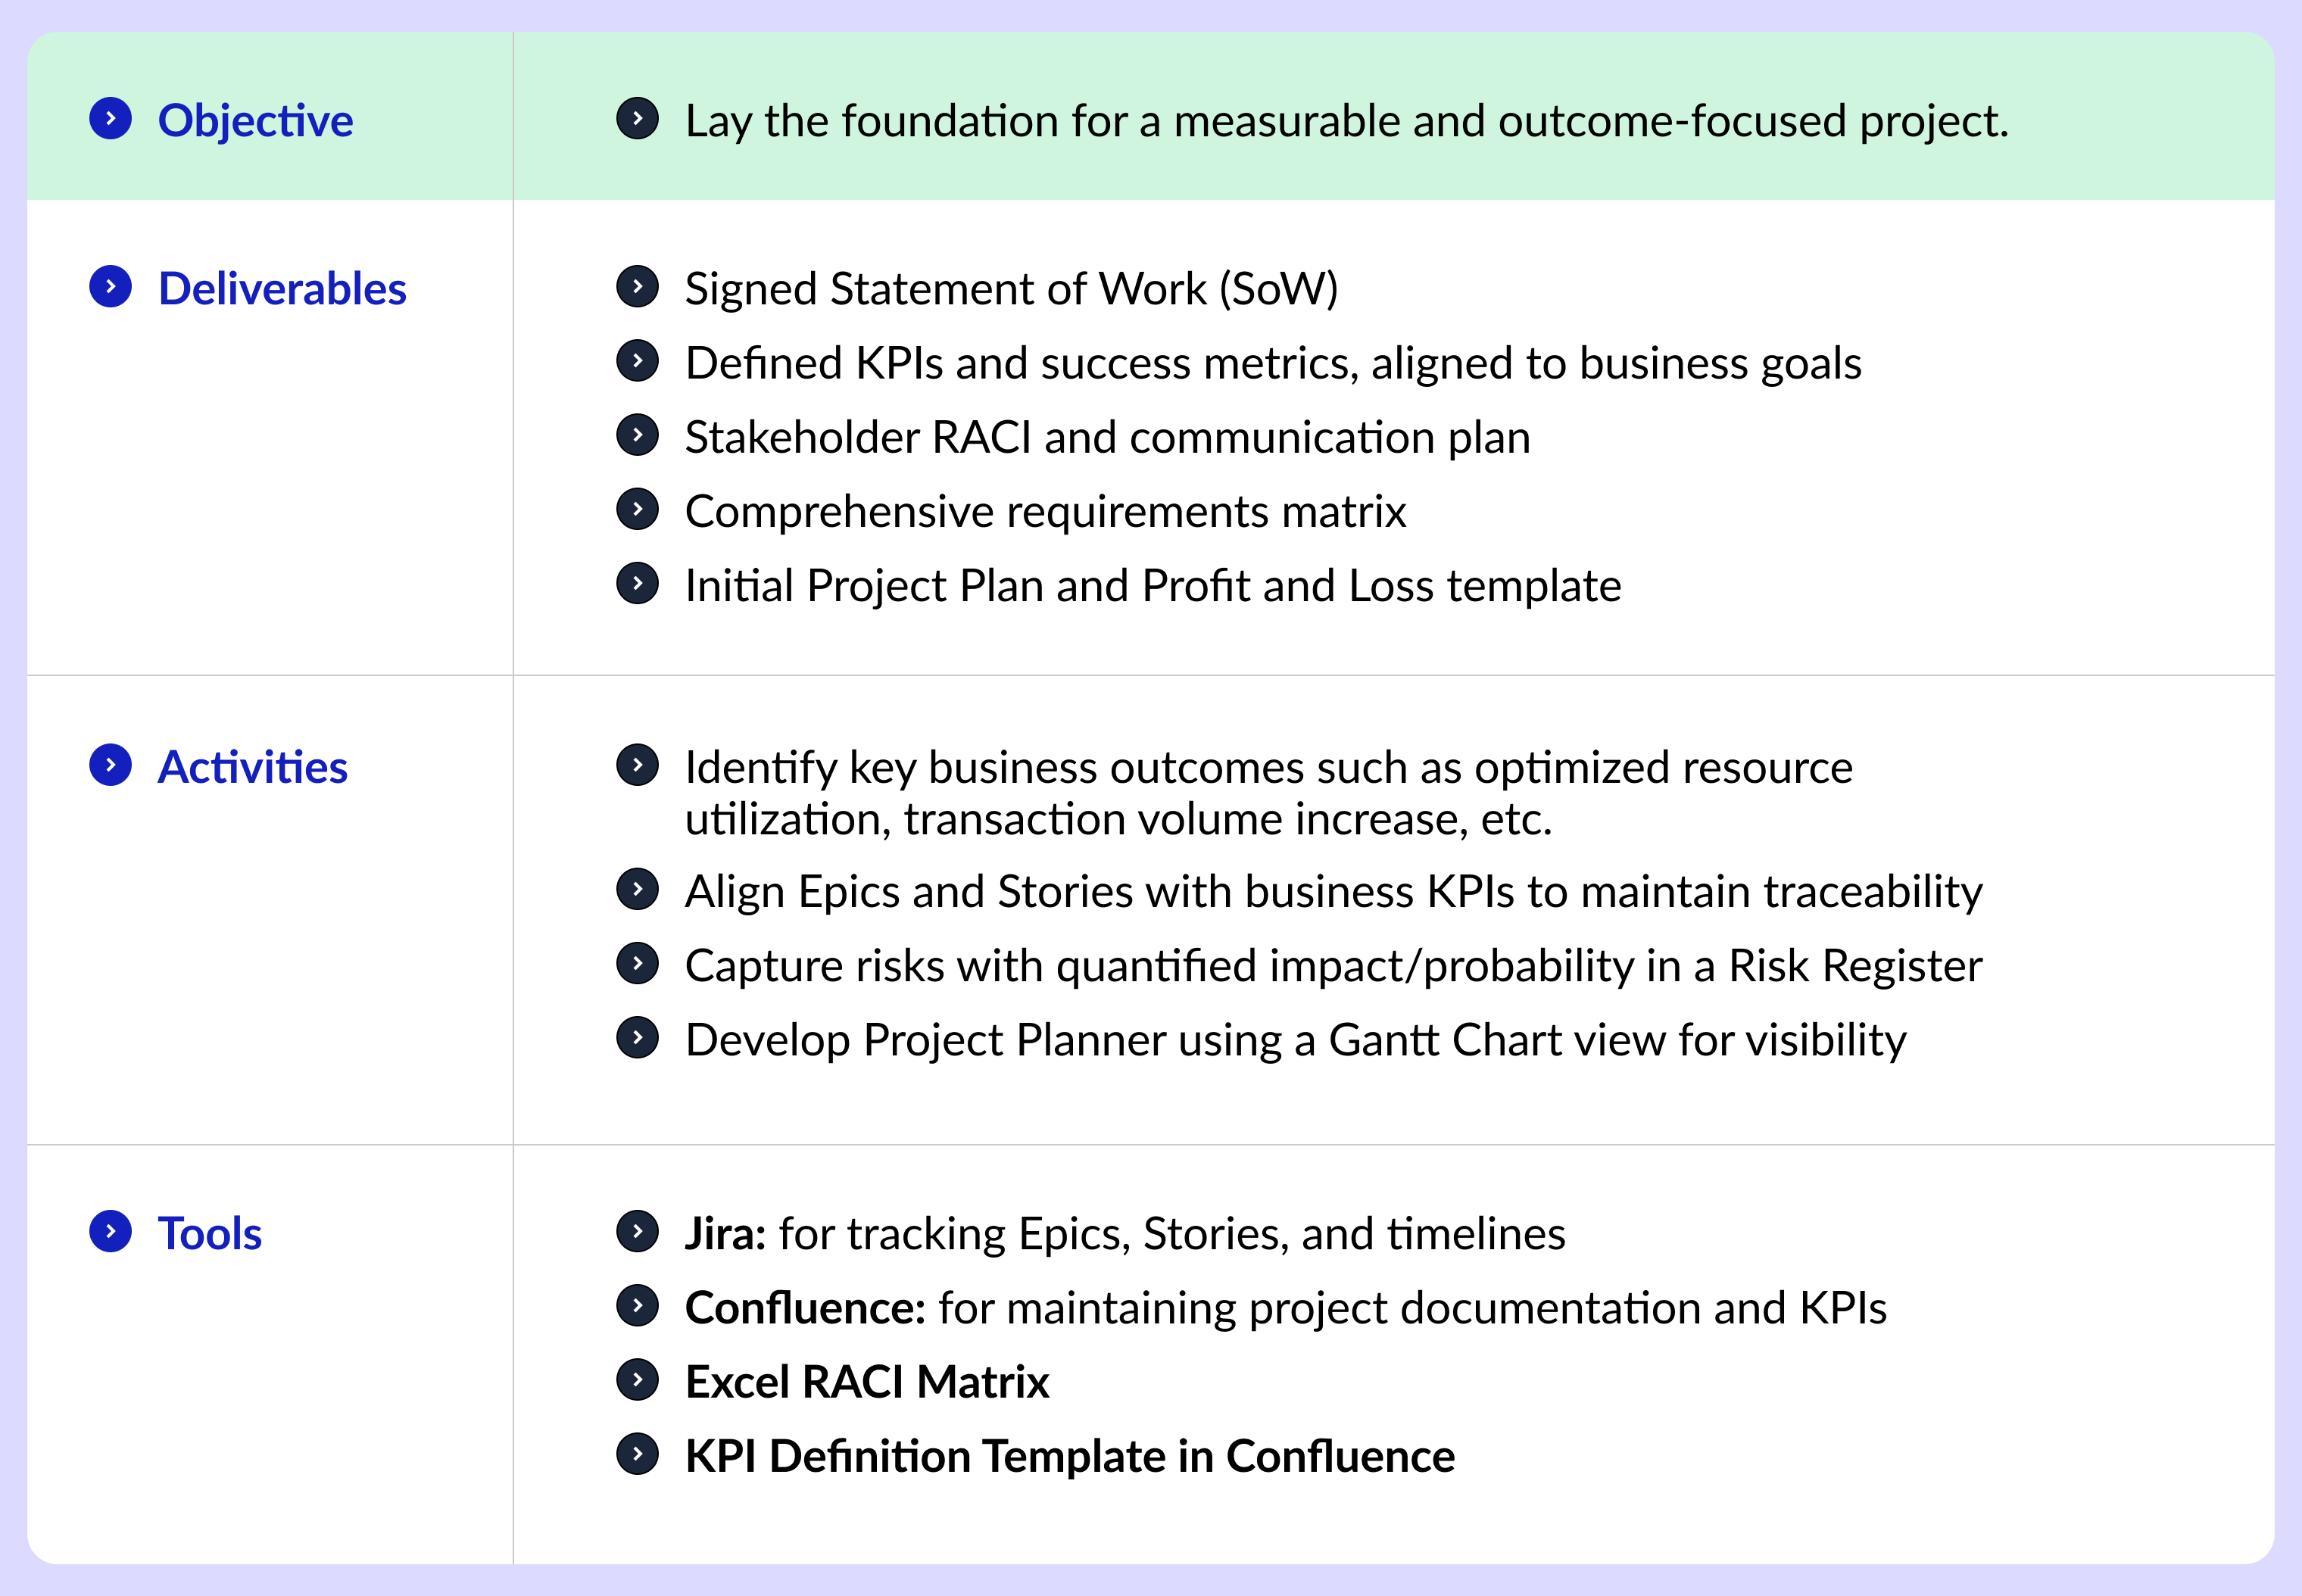
Delivery doesn’t begin with coding—it starts with agreeing on outcomes. At the start of a project, we focus not only on defining the scope but also on clarifying what success means. We utilize tools like Jira and Confluence to align KPIs with business outcomes, define roles for stakeholders, and monitor potential delivery risks. This way, every sprint and story later in the project has a clear, measurable purpose.

Pro tip: Align epics with KPIs from the beginning. Don't treat estimation as an afterthought.
Framing Delivery Through Measurable Discovery

Estimation Meets Reality: Capacity Planning

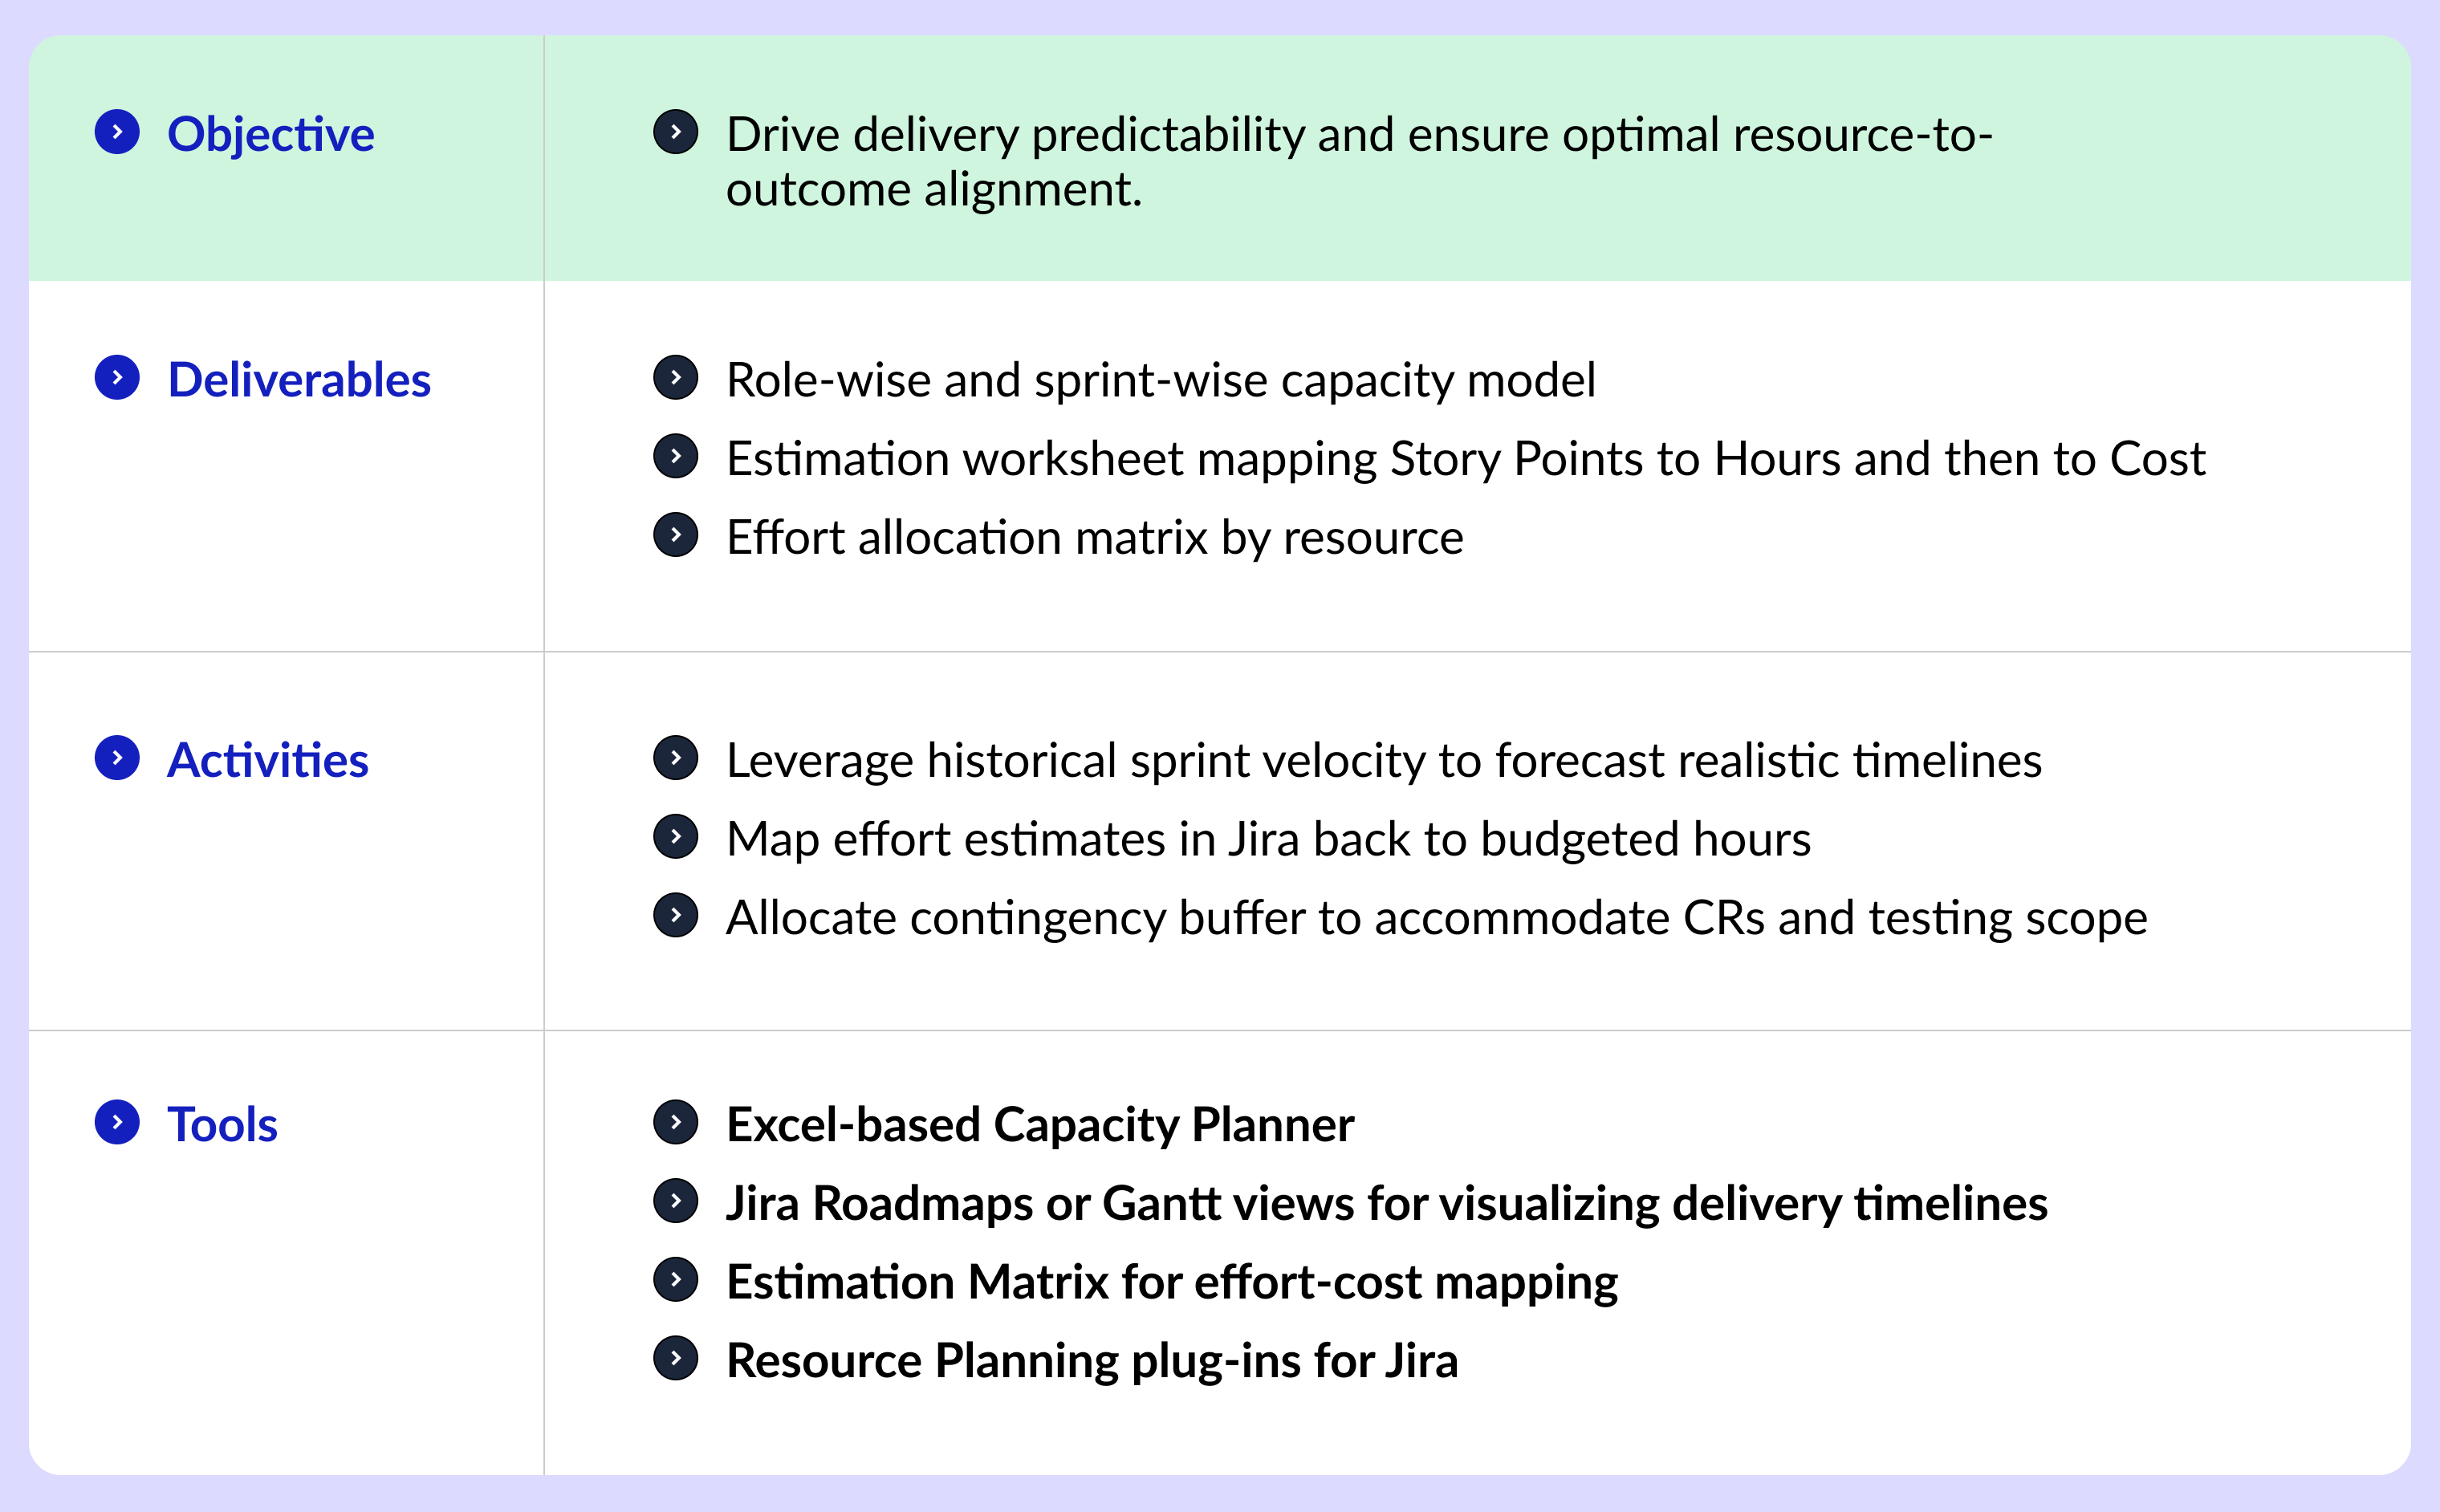
Effort estimation is where many projects begin to lose focus. At Minfy, we combine past sprint velocity, buffer logic, and real-time effort tracking to produce more accurate forecasts. Each sprint has a defined capacity model and a resource allocation sheet. By linking story points to hours and hours to cost, we monitor not just what we deliver, but how efficiently we do it.

Try this: Create a sprint capacity planner that directly connects to cost dashboards, enabling project managers to see burn versus budget in real time.
Estimation Meets Reality: Capacity Planning

Data-Linked Agile Execution

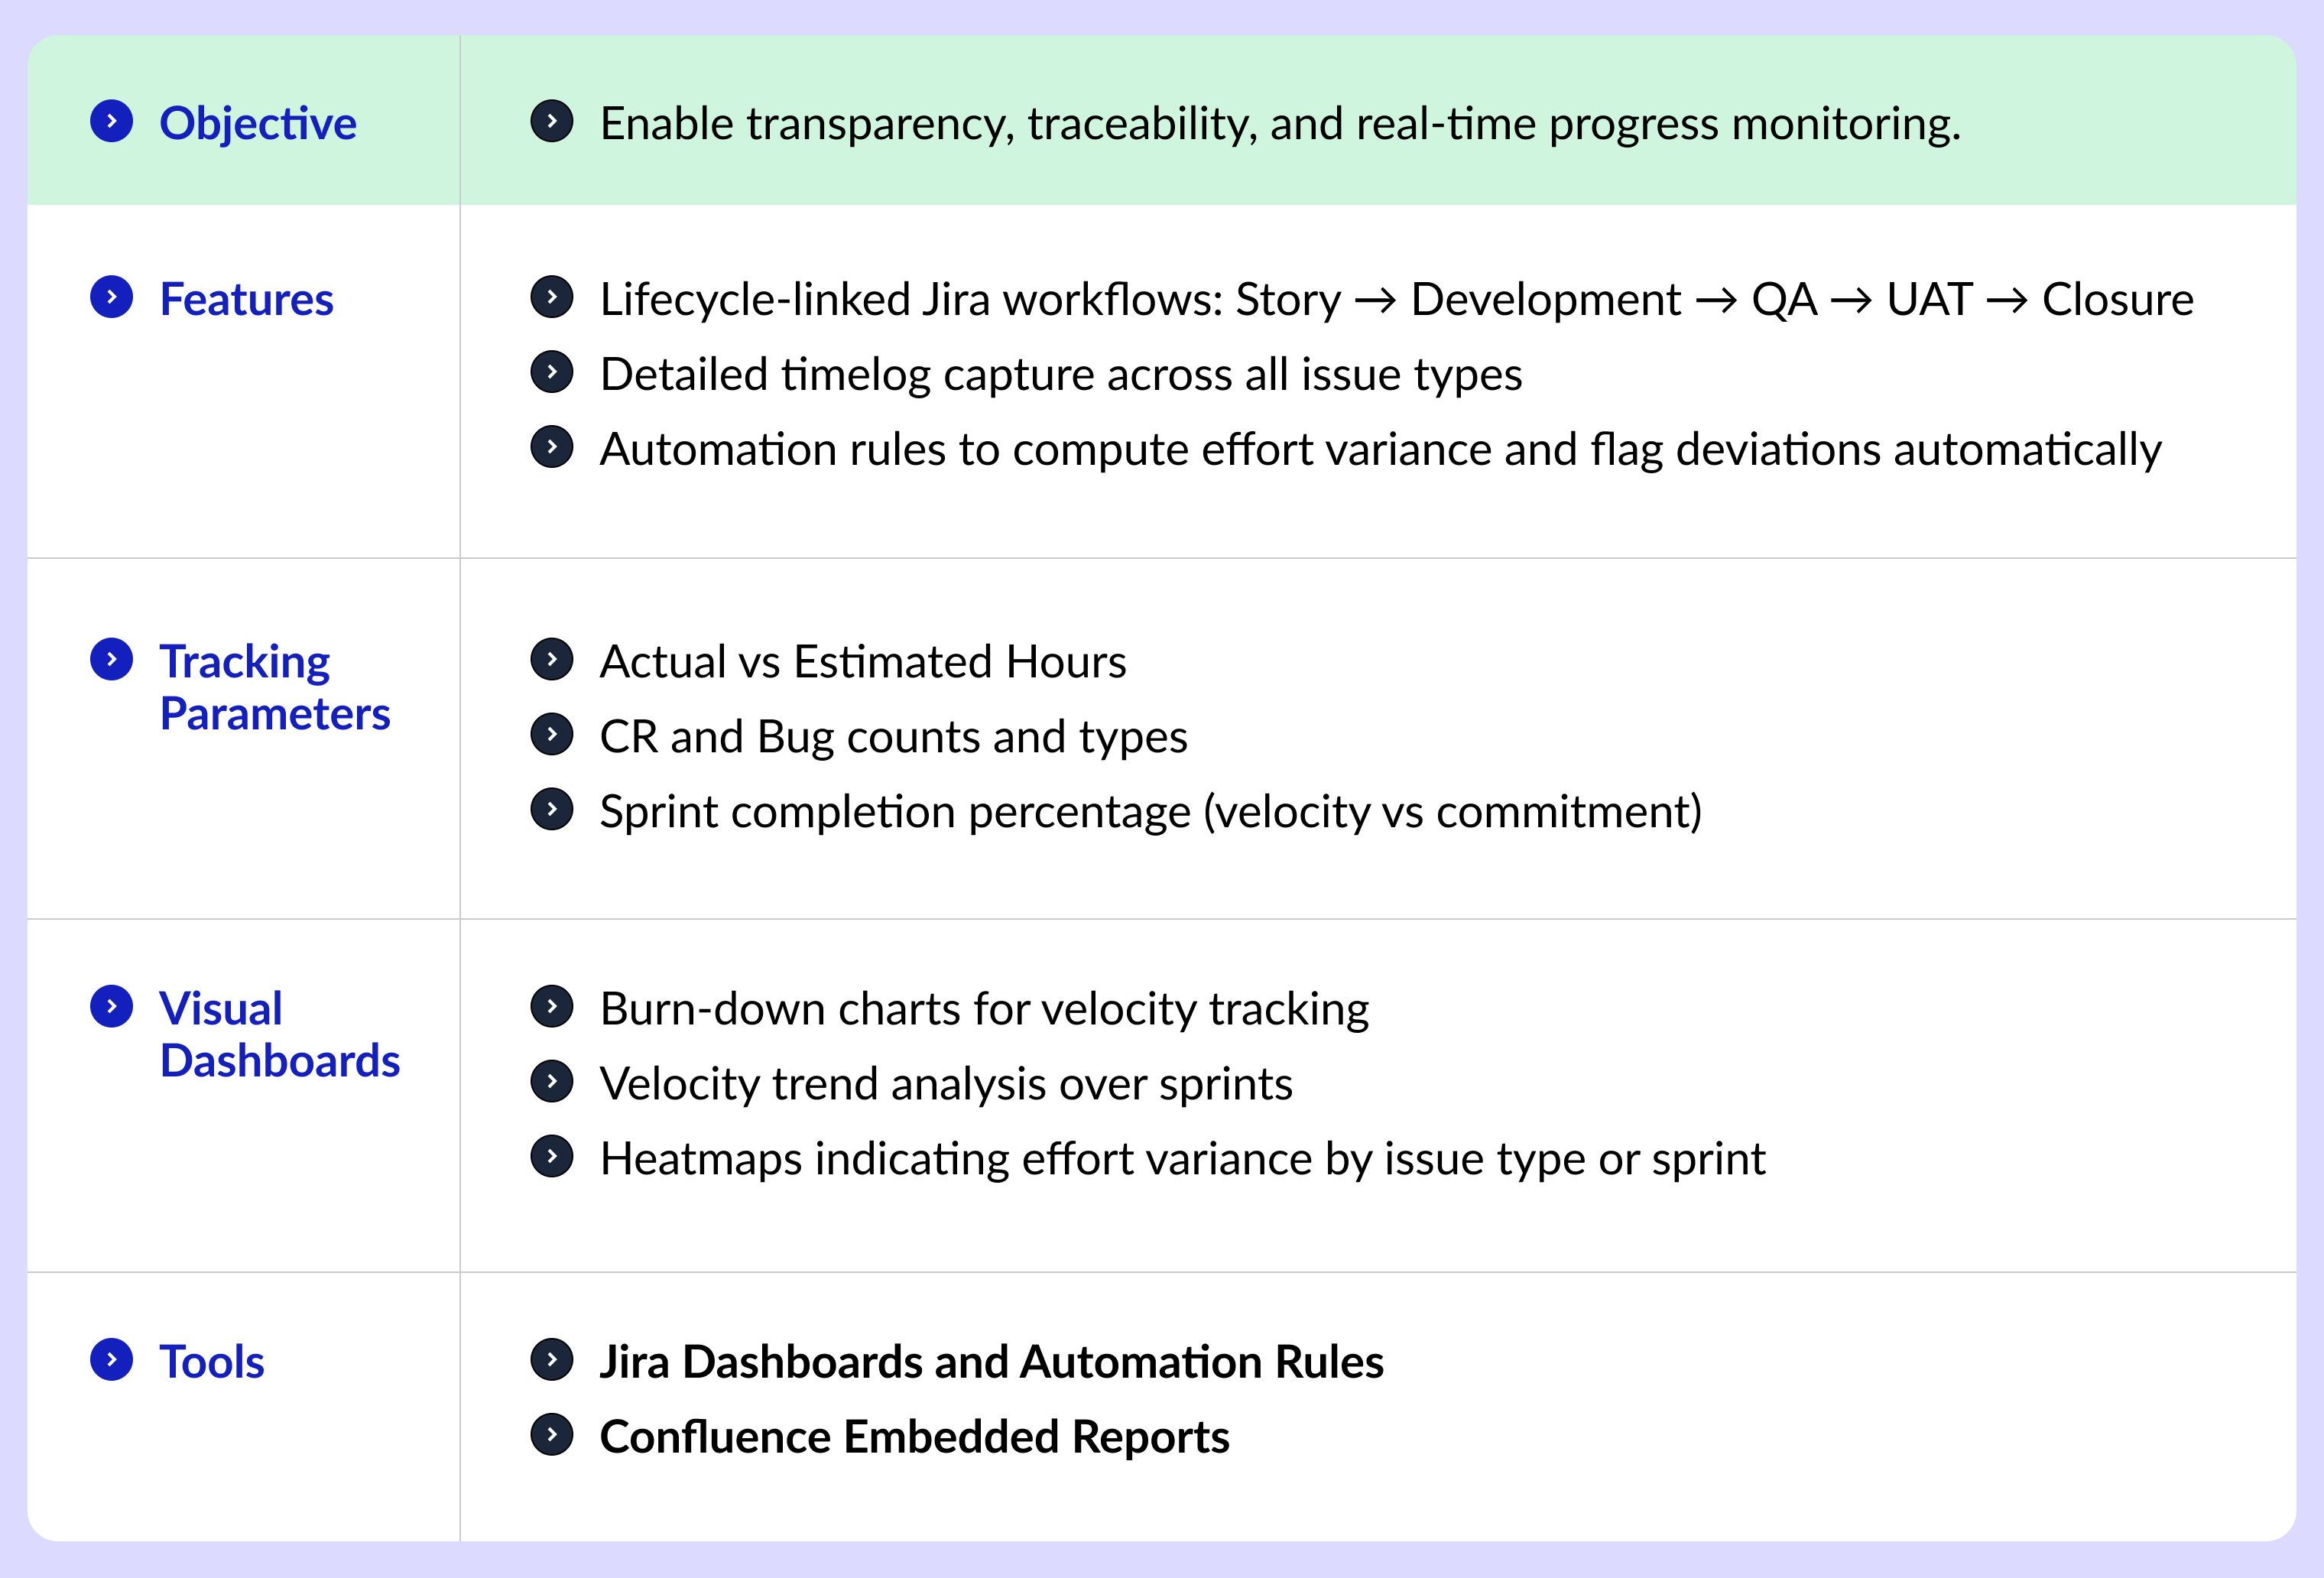
Every Jira ticket—whether a story, task, bug, or change request—connects to a stage in the project lifecycle and a time log. This approach isn't about micromanagement; it allows for traceability. We implement automation rules to highlight discrepancies between effort and estimates. Dashboards display sprint progress, velocity trends, and problem areas. Agile processes here are not only iterative but also measured.  

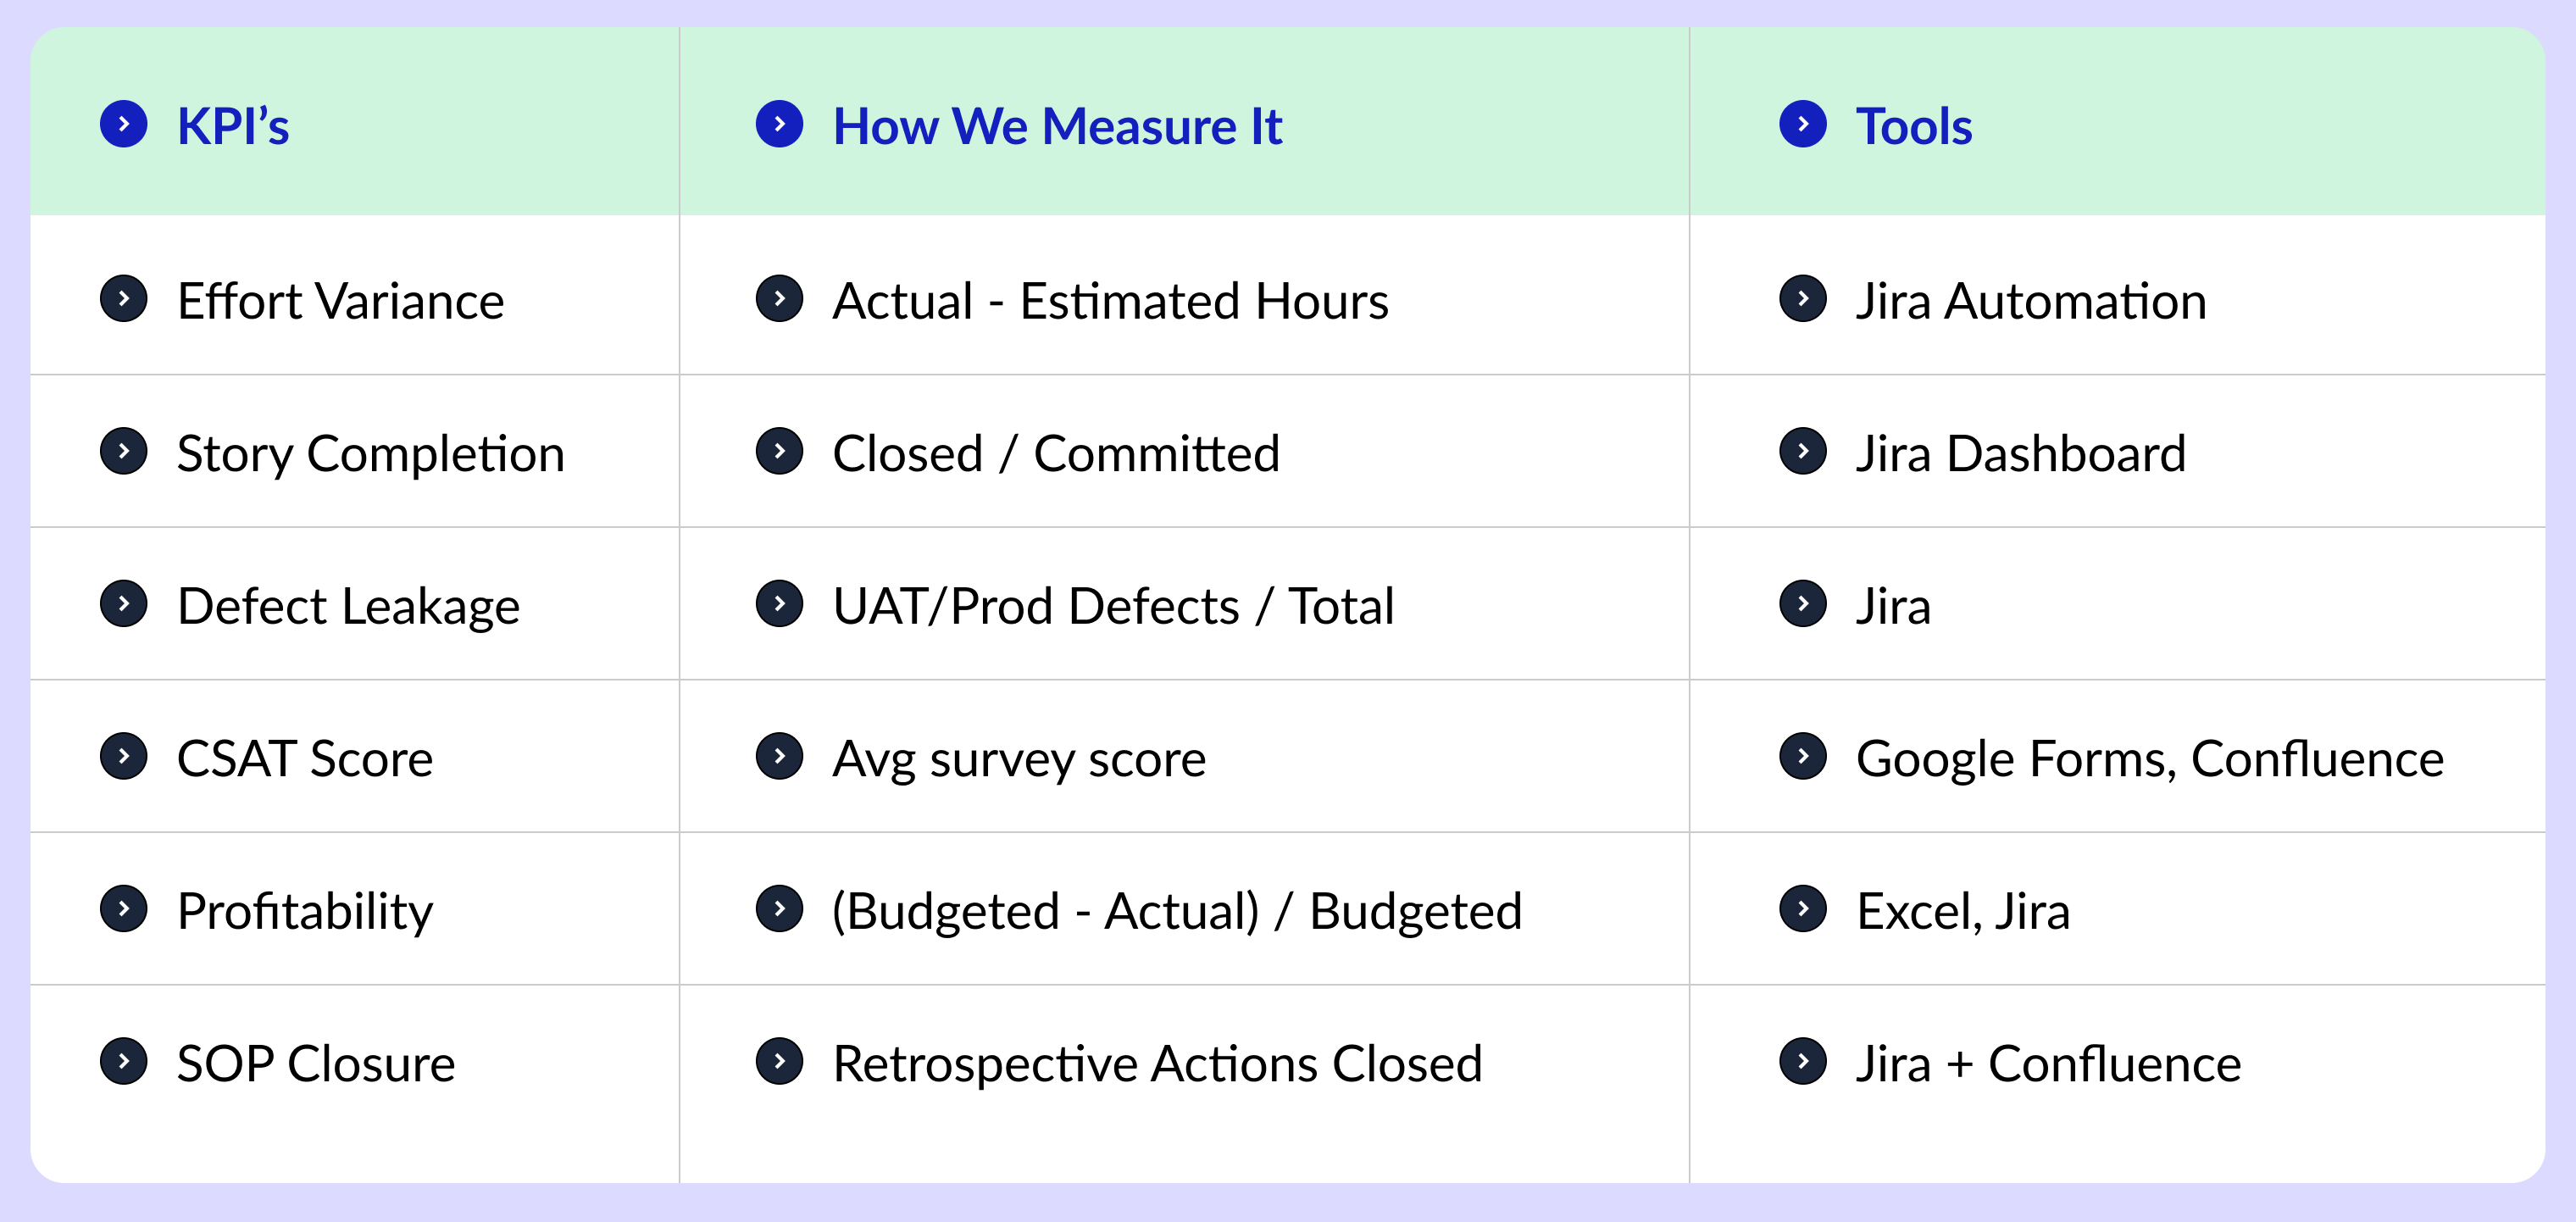
Key metric: Effort variance = Actual - Estimated. Flag any variances above 20% early.
Data-Linked Agile Execution

Measuring Quality, Not Just Testing

Quality assurance involves more than just running tests; it's about ensuring your system functions correctly, even when scale and changes are involved. Our framework connects test cases directly to user stories, facilitating regression tracking, defect density metrics, and user acceptance testing (UAT) coverage analytics. Tools like Bitbucket and Jira help visualize the connection from testing to deployment.

Be cautious of: Test cases that aren’t linked to stories, as these can lead to poor regression coverage and increased defect leakage.

Measuring Quality, Not Just Testing

Making Customer Happiness Quantifiable

Outstanding delivery can still disappoint without proactive communication. To build trust, we focus on capturing engagement metrics such as customer satisfaction, feedback, and deviation alerts. We automate weekly reports and post-release customer satisfaction surveys. Stakeholder dashboards are constantly updated with status reports, risks, and resolutions.  

Tip: Break down customer satisfaction into delivery, timeliness, and communication, and use historical trends to inform retrospectives.

Making Customer Happiness Quantifiable

Profitability as a Delivery KPI

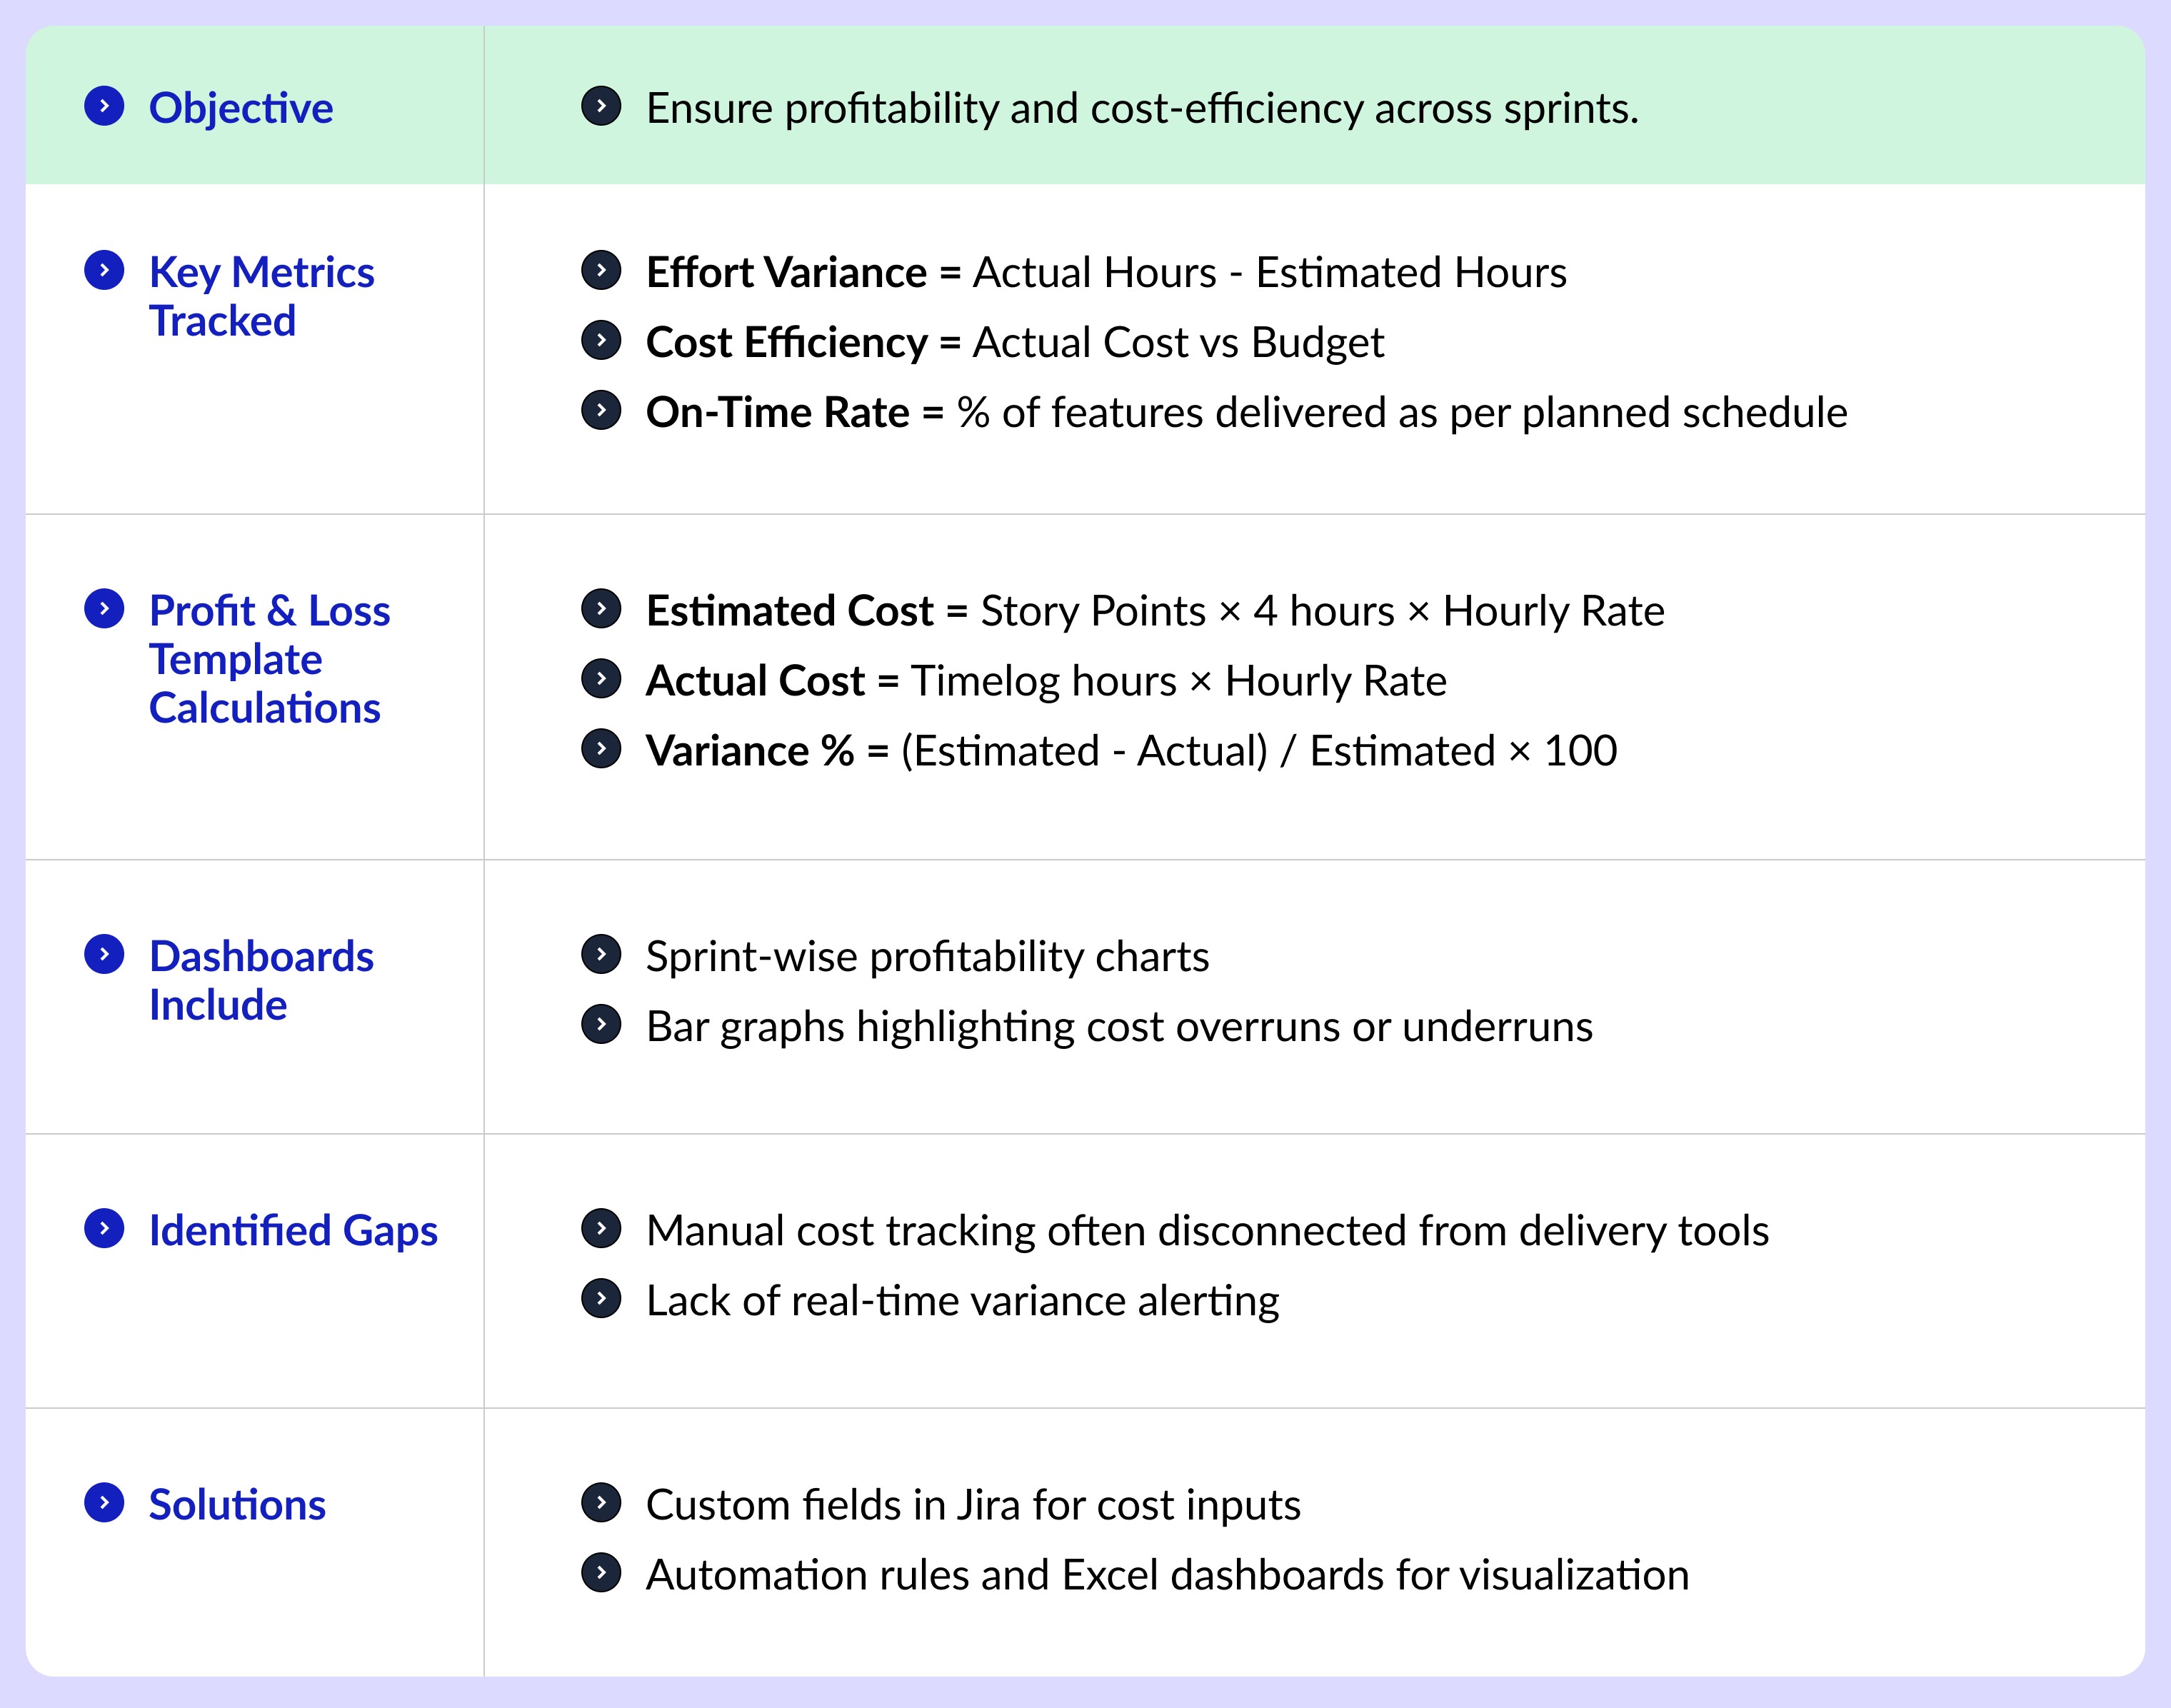
One often-missed metric in delivery is project profitability. By using simple effort-cost formulas, we analyze the variance per sprint and visualize how efficiently a team is delivering.  

This not only promotes effective execution but also helps delivery leads take timely action before costs rise or timelines become jeopardized.  

Sample Calculation:
Estimated Cost = Story Points × 4 hrs × Hourly Rate
Actual Cost = Logged Time × Hourly Rate
Variance % = (Estimated - Actual) / Estimated

Takeaway: Delivery teams should know their P&L. Profit isn’t just a finance metric—it’s a delivery health metric.
Profitability as a Delivery KPI

Transitioning with Confidence

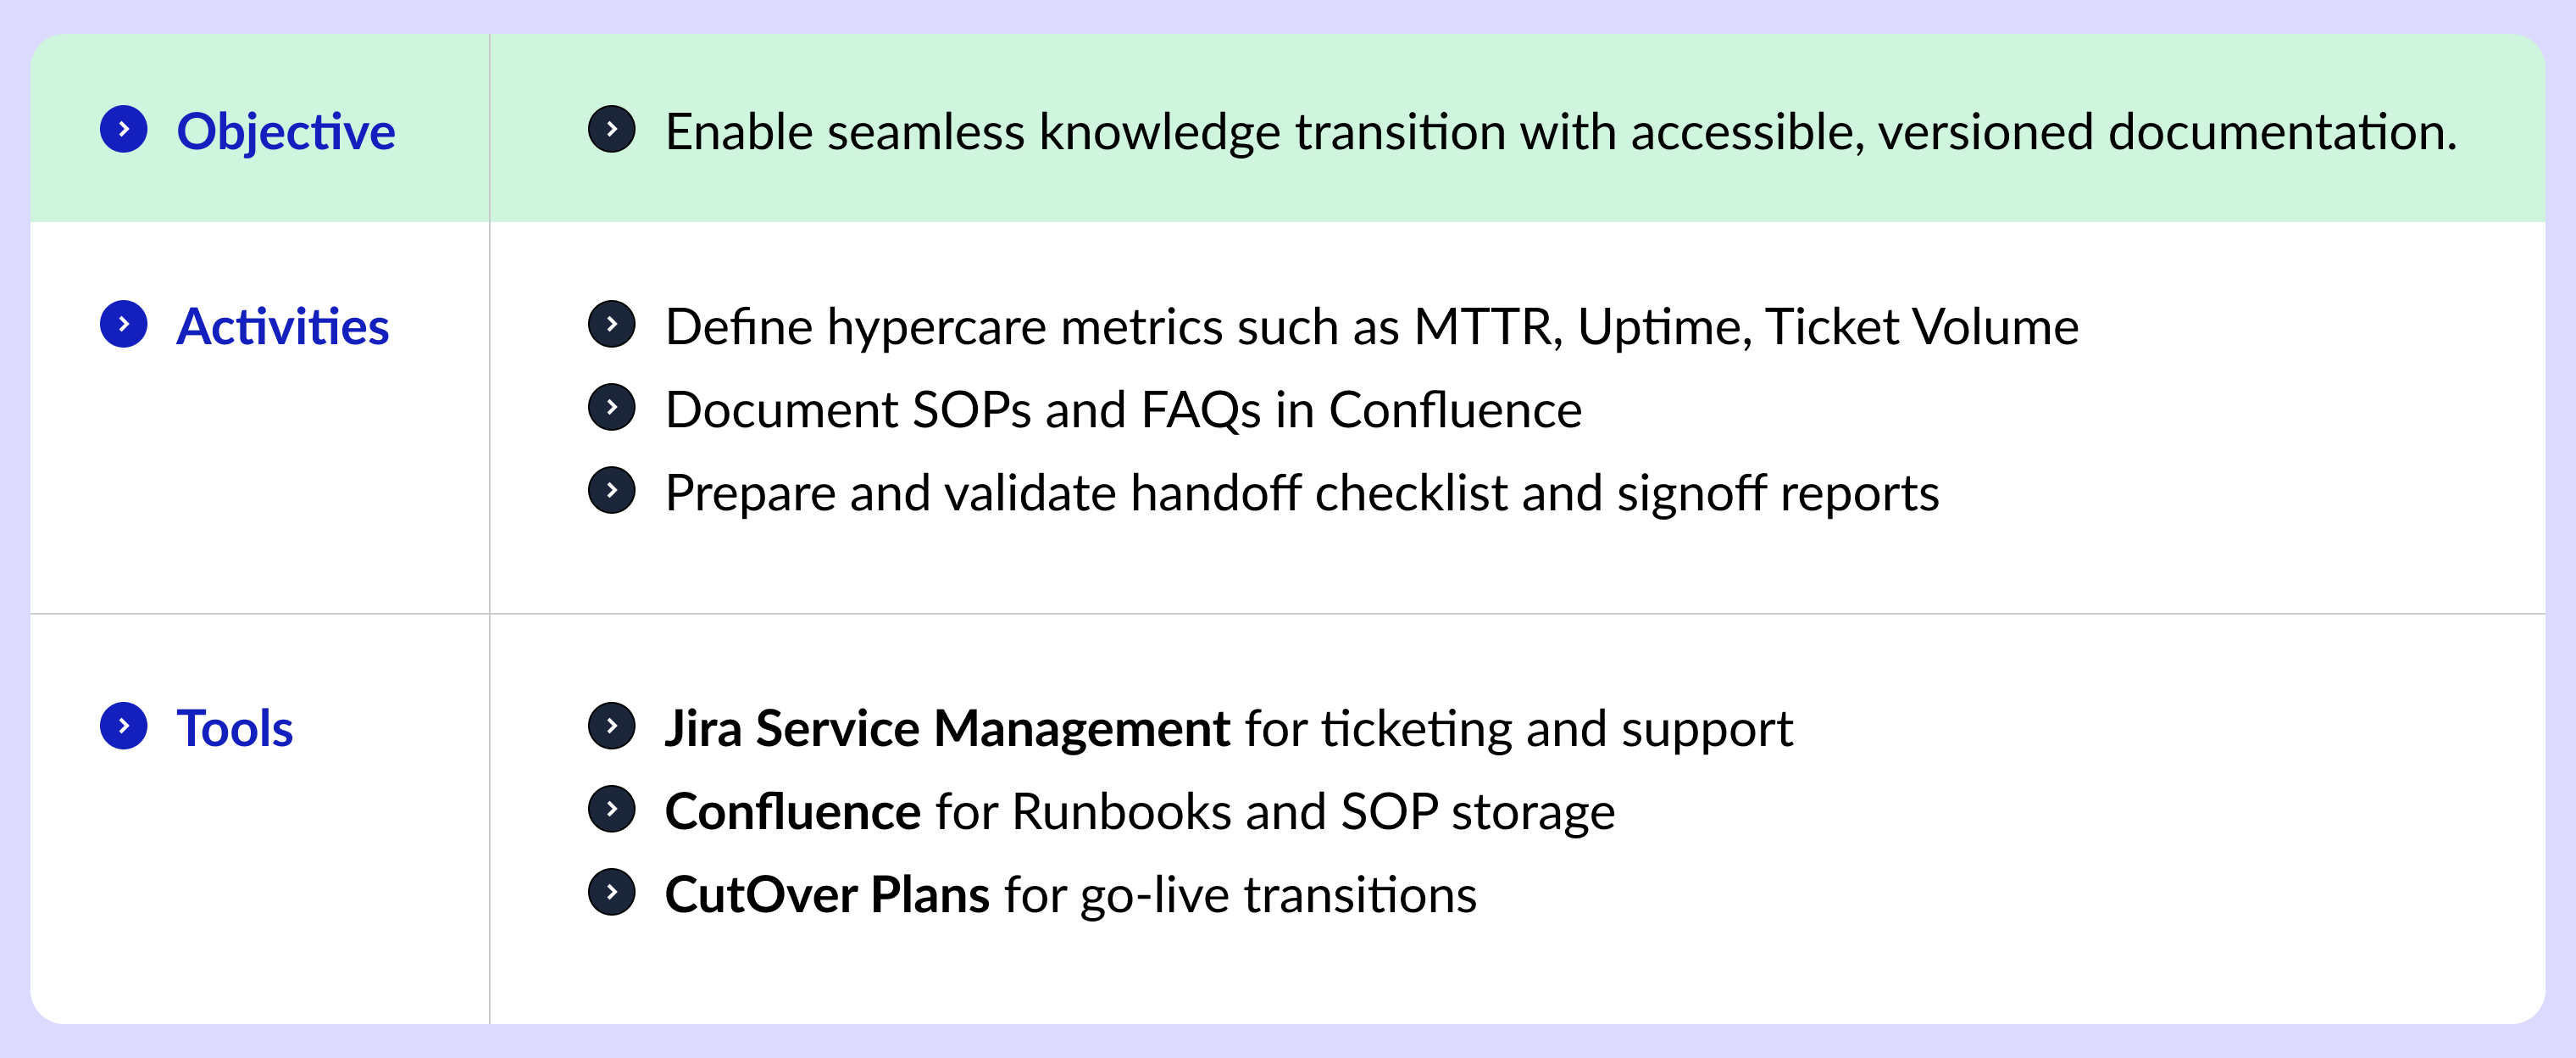
All successful projects conclude well. During the handoff phase, we compile standard operating procedures, FAQs, and root cause analysis logs in Confluence to ensure support teams are well-prepared. Handoffs follow checklists, are version-controlled, and are auditable, making transitions smooth for both customers and support staff.  

Tip: Identify hypercare KPIs like mean time to recovery and ticket volume upfront, and connect them to delivery service level agreements.
Transitioning with Confidence

Feedback Loops That Actually Close

Most retrospectives suffer from short-term memory. We address this by linking actions from retrospectives to standard operating procedures and using Jira components to track root causes. Improvements are based on data: reduced rates of ticket reopens, increased closure of action items, and fewer recurring issues.  

Sustain it: Create a library of standard operating procedures with update trails and review it in every retrospective.  

Feedback Loops That Actually Close

So, What Does This All Add Up To?

Data-driven delivery isn’t a buzzword—it’s a shift in mindset. It treats delivery not as a black box, but as a system that can be measured, improved, and scaled.

Here’s a quick snapshot of how we quantify success at every step:
So, What Does This All Add Up To?

Conclusion

Delivery teams often drown in execution—but it’s the ones that learn to measure and reflect that consistently grow. At Minfy, our framework helps every team become self-improving, every project become accountable, and every customer interaction build trust. If you're managing complex deliveries or scaling engineering teams, consider building your own version of a data-driven framework. Not just to track—but to transform.


Rama Krishna Vaddi
|
August 29, 2025

Leave a Reply

Thank you! Your submission has been received!
Oops! Something went wrong while submitting the form.

Stay Ahead of Tech Trends.

blogs  |
August 26, 2025

Transform delivery with a data-driven framework for measurable project success.

How Minfy Uses Data-Driven Delivery to Engineer Project Success

In a world where speed was once the only priority, modern delivery requires more. It’s not enough to deliver quickly; the process must be measurable, predictable, and repeatable. At Minfy, we have embraced this change by creating a Data-Driven Delivery Framework that combines agile execution with a strong focus on measurable success metrics. This blog outlines the framework’s components, not as a theory, but as an effective system that helps us monitor progress, improve collaboration, and achieve real business results. Whether you’re a delivery manager, engineering lead, or developer, this is a practical look at how data can lead to smarter and more profitable software delivery.

Why Data-Driven Delivery Matters

Traditional success metrics for projects, such as completing sprints or meeting deadlines, don’t provide the full picture. How efficient were our resources? Were the estimates realistic? Did we keep customers engaged throughout? Were we profitable? A data-driven approach clarifies these questions. It connects every task, bug, or change request to a measurable impact on effort, cost, customer satisfaction, and long-term value.

Framing Delivery Through Measurable Discovery

Delivery doesn’t begin with coding—it starts with agreeing on outcomes. At the start of a project, we focus not only on defining the scope but also on clarifying what success means. We utilize tools like Jira and Confluence to align KPIs with business outcomes, define roles for stakeholders, and monitor potential delivery risks. This way, every sprint and story later in the project has a clear, measurable purpose.

Pro tip: Align epics with KPIs from the beginning. Don't treat estimation as an afterthought.

Framing Delivery Through Measurable Discovery

Estimation Meets Reality: Capacity Planning

Effort estimation is where many projects begin to lose focus. At Minfy, we combine past sprint velocity, buffer logic, and real-time effort tracking to produce more accurate forecasts. Each sprint has a defined capacity model and a resource allocation sheet. By linking story points to hours and hours to cost, we monitor not just what we deliver, but how efficiently we do it.

Try this: Create a sprint capacity planner that directly connects to cost dashboards, enabling project managers to see burn versus budget in real time.

Estimation Meets Reality: Capacity Planning

Data-Linked Agile Execution

Every Jira ticket—whether a story, task, bug, or change request—connects to a stage in the project lifecycle and a time log. This approach isn't about micromanagement; it allows for traceability. We implement automation rules to highlight discrepancies between effort and estimates. Dashboards display sprint progress, velocity trends, and problem areas. Agile processes here are not only iterative but also measured.  

Key metric: Effort variance = Actual - Estimated. Flag any variances above 20% early.

Data-Linked Agile Execution

Measuring Quality, Not Just Testing

Quality assurance involves more than just running tests; it's about ensuring your system functions correctly, even when scale and changes are involved. Our framework connects test cases directly to user stories, facilitating regression tracking, defect density metrics, and user acceptance testing (UAT) coverage analytics. Tools like Bitbucket and Jira help visualize the connection from testing to deployment.

Be cautious of: Test cases that aren’t linked to stories, as these can lead to poor regression coverage and increased defect leakage.

Measuring Quality, Not Just Testing

Making Customer Happiness Quantifiable

Outstanding delivery can still disappoint without proactive communication. To build trust, we focus on capturing engagement metrics such as customer satisfaction, feedback, and deviation alerts. We automate weekly reports and post-release customer satisfaction surveys. Stakeholder dashboards are constantly updated with status reports, risks, and resolutions.  

Tip: Break down customer satisfaction into delivery, timeliness, and communication, and use historical trends to inform retrospectives.

Making Customer Happiness Quantifiable

Profitability as a Delivery KPI

One often-missed metric in delivery is project profitability. By using simple effort-cost formulas, we analyze the variance per sprint and visualize how efficiently a team is delivering.  

This not only promotes effective execution but also helps delivery leads take timely action before costs rise or timelines become jeopardized.  

Sample Calculation:
Estimated Cost = Story Points × 4 hrs × Hourly Rate
Actual Cost = Logged Time × Hourly Rate
Variance % = (Estimated - Actual) / Estimated

Takeaway: Delivery teams should know their P&L. Profit isn’t just a finance metric—it’s a delivery health metric.

Profitability as a Delivery KPI

Transitioning with Confidence

All successful projects conclude well. During the handoff phase, we compile standard operating procedures, FAQs, and root cause analysis logs in Confluence to ensure support teams are well-prepared. Handoffs follow checklists, are version-controlled, and are auditable, making transitions smooth for both customers and support staff.  

Tip: Identify hypercare KPIs like mean time to recovery and ticket volume upfront, and connect them to delivery service level agreements.

Transitioning with Confidence

Feedback Loops That Actually Close

Most retrospectives suffer from short-term memory. We address this by linking actions from retrospectives to standard operating procedures and using Jira components to track root causes. Improvements are based on data: reduced rates of ticket reopens, increased closure of action items, and fewer recurring issues.  

Sustain it: Create a library of standard operating procedures with update trails and review it in every retrospective.  

Feedback Loops That Actually Close

So, What Does This All Add Up To?

Data-driven delivery isn’t a buzzword—it’s a shift in mindset. It treats delivery not as a black box, but as a system that can be measured, improved, and scaled.

Here’s a quick snapshot of how we quantify success at every step:

So, What Does This All Add Up To?

Conclusion

Delivery teams often drown in execution—but it’s the ones that learn to measure and reflect that consistently grow. At Minfy, our framework helps every team become self-improving, every project become accountable, and every customer interaction build trust. If you're managing complex deliveries or scaling engineering teams, consider building your own version of a data-driven framework. Not just to track—but to transform.

Author
Rama Krishna Vaddi
Author
To know more
Contact
Recent Blogs
Blogs
July 10, 2026
Enterprise Adoption Starts Where Most AI Demos End
Blogs
May 29, 2026
The Question Took Two Seconds. Safely Joining Five Systems, Masking Sensitive Fields...
About Minfy
Minfy is an applied AI and technology services company helping enterprises and public-sector organizations move from cloud and data foundations to production-scale AI. Across advisory, engineering, implementation and managed operations, Minfy modernizes technology, builds intelligent and agentic applications, unlocks enterprise data and operates mission-critical systems.

Minfy combines deep cloud, data and engineering capabilities with proprietary architectures, governance frameworks and industry solutions—including mTRUST7, mVISTA and mPRISMA—to help customers take AI initiatives from initial use case to secure enterprise deployment and continuous operations. These capabilities are strengthened by partnerships with leading global cloud and AI technology providers.

Founded in 2016, Minfy serves Fortune Global 500 companies, public-sector organizations and high-growth businesses across North America, India and Asia-Pacific. Minfy was named a Leader and Star Performer in the Everest Group’s AWS Services PEAK Matrix® Assessment 2025 and a Seasoned Vendor in AIM Research’s PeMa Quadrant for GenAI Service Providers 2026. 

Minfy’s ambition is to become the trusted partner for making enterprise AI dependable, scalable and operational.

Explore more blogs

Blogs
March 27, 2024
How AI is Changing the Game in Chronic Disease Care
Blogs
May 29, 2026
The Question Took Two Seconds. Safely Joining Five Systems, Masking Sensitive Fields...
Blogs
March 27, 2024
Migrating to Cloud: 6 Things to Consider When Choosing a Trustworthy Cloud Services Provider